
ALL OF ABORD: Is it ARENA?
ARENA is the market-leading simulation software for discrete event streams.
Published by Rockwell Automation, it has more than 370,000 trained users worldwide. Distributed in France since 1987, ARENA has accompanied major industrial projects for Peugeot, Alstom, Nestlé, Paris Airport, Saint-Gobain … Etc.
ARENA is the most advanced version of the simulation of production systems to date. From the first click of the mouse to the presentation of the results.
It is the first simulation tool to analyze large volumes, complex control logic and specialized equipment of production systems.
 The construction of a simulation is done through two data structures:
-
The model, description of the static and dynamic components of the system
-
The instance, specification of experimental conditions and parameters specific to an experiment
It has multiple libraries and modules (blocks) that make it easy to model a resource, a queue, a conveyor belt and all the elements of a production system.
In this page, I do not go back to the pros and cons of ARENA as a simulation tool but I only explain how to download, install and use this tool through simple examples.
1. Download and install ARENA Gratruitment
Arena simulation software is available in two "Free and Paying" versions.
In the video below I explain everything in detail
Before YOU start ARENA: Understanding the queues
2. Queue Management: Example with solution
Difficulty level: 
A workstation to manufacture two products rated A and B.
– Products A arrive every 10 minutes. Their operating time is 4 minutes.
– Products B arrive every 6 minutes from t – 3 minutes. Their operating time is 3 minutes.
– When a product arrives, if the position is available, it is processed by the product.
– If the position is filled, the products wait in a FIFO-managed queue.
Try to find the answers to the following questions:

In the video below I explain all the details.
—-Learn the basics of ARENA: three simple examples—
Example 1: Create and simulate a simple example with a single "Piece Control" process
Difficulty level:

Has. How to use blocks: Create-Process-Dispose
B. How to set up my project and the length of the simulation
C. How to generate and read a report
In the video below I explain all the details.
Example 2: Create and simulate an example with two "Production and Control" processes and one decision
Difficulty level:
Has. How to limit the number of arrivals to 100 parts that are created by the system
B. How to incorporate a decision to sort good parts (80%) and bad (20%)
C. How to change the format of features (put a ball or truck in place of a report)
In the video below I explain all the details.
Example 3: Create and simulate an example with two processes and differentiate the colors of the pieces
Difficulty level:
Has. How to limit the number of arrivals to 100 parts that are created by the system
B. How to incorporate a decision to sort good parts (80%) and bad (20%)
C. How to change the format of features (put a ball or truck in place of a report)
In the video below I explain all the details.
—-Learn the basics of ARENA: with case studies—
Case Study No.1: Washing Station (Level 1)
Difficulty level:
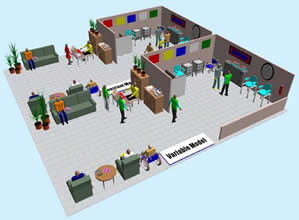
A gas station is frequented by two categories of motorists. The former first wash their cars and then get fuel from one of the two pumps, the latter only refuel.
Various observations at other service stations provide:
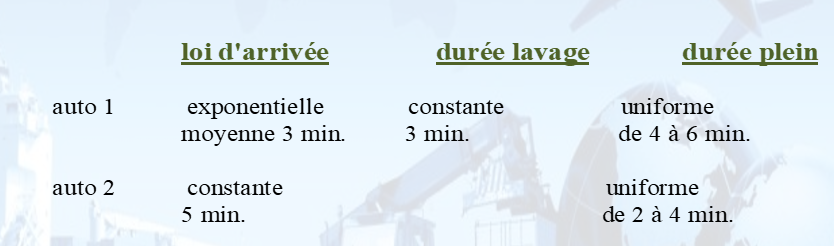
We want to watch the gas station run for two hours.
Queue levels and attendance rates at pumps and washing stations should be characterized, and clients' stay in the station should be measured.
To solve this case study, we will proceed in two steps:
Step 1: Modeling the operation under a logical model
Step 2: Build the model under ARENA without the indicators
Step 3: Make the model under ARENA with the indicators
Step 1: Modeling the operation under a logical model
Before making the model on Arena, it is best to first create a logical model that explains and summarizes all the data. Below is the logical model of this station:

Step 2: Make the model under ARENA
In the video below I explain step by step the realization of this model under ARENA.
You can also download the corrected (ARENA Model) by clicking below:
 https://youtu.be/hrtDp3M-eRg?list=PLLk00LzBzwBcgzOTKMQVwLIyjhMpEbttz
Step 3: Make the model under ARENA with the indicators
In the video below I explain step by step the realization of this model under ARENA with the required performance indicators.
You can also download the corrected (ARENA Model) by clicking below:
https://youtu.be/IocGYQxyY9c?list=PLLk00LzBzwBcgzOTKMQVwLIyjhMpEbttz
Case Study No.2: Simulation of an assembly station with pause
Difficulty level:
An assembly station is powered every 7 minutes; these parts are of four types that require 4, 6, 8 and 9 minutes of assembly respectively.
The frequencies of the four types are identical.
The work is done by a single editor who pauses for 15 minutes every 4 hours after completing the piece being assembled.
Simulate the operation of the station for 80 hours and measure in particular:
– The number of parts waiting to be assembled
– The actual activity rate of the fitter
– The length of stay of the parts in the assembly station
To solve this case study, we will proceed in two steps:
Step 1: Modeling the operation under a logical model
Step 2: Make the model under ARENA
Step 1: Modeling the operation under a logical model
Before making the model on Arena, it is best to first create a logical model that explains and summarizes all the data. Below is the logical model of this station:

Step 2: Make the model under ARENA
In the video below I explain step by step the realization of this model under ARENA.
You can also download the corrected (ARENA Model) by clicking below:
https://youtu.be/NFbgQR6LPIs
Case study No.3:
Management of Queues under ARENA and use of BLOCKS (Video Suite No.2)
Difficulty level:
Note: This part is the continuation of the exercise carried out in the first part of this training. That's why I invite anyone who hasn't yet figured out the principle of queues to go back to video No. 2.
Recall of starting data:
A workstation to manufacture two products rated A and B.
– Products A arrive every 10 minutes. Their operating time is 4 minutes.
– Products B arrive every 6 minutes from t – 3 minutes. Their operating time is 3 minutes.
– When a product arrives, if the position is available, it is processed by the product.
– If the position is filled, the products wait in a FIFO-managed queue.
In the video below I explain step by step the realization of this model under ARENA.
You can also download the corrected (ARENA Model) by clicking below:
https://youtu.be/gbkiMbvCN68?list=PLLk00LzBzwBcgzOTKMQVwLIyjhMpEbttz
Several machines of the same type (SET) with and without operator
Reminder:
ELEMENTS SET: Defining an indexed object group (Resource, queue ,…)
If more than one resource is usable, the resource that will be used will have to be selected.
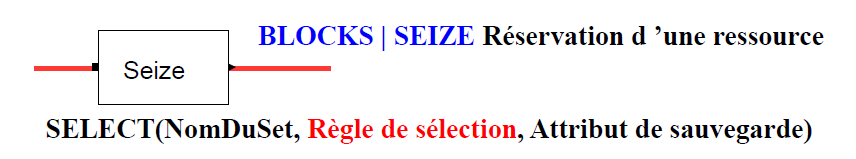
Selection rules:
CYC: Cyclical priority
LNB: Choosing the most capacity resource used.
LRC: Choosing the resource with the highest remaining free capacity.
POR: Preferred order
RAN: Random choice
SNB: Choosing the resource with the smallest capacity used.
SRC: Choosing the resource with the smallest remaining free capacity.
Case study No.4:
Several identical machines (SETS) without operator
Difficulty level: 
Recall of starting data:
A company has a manufacturing workshop consisting of three identical machines
The parts to be machined arrive every 6 minutes,
The operating time for each product follows an exponential law averaging 5 minutes
The choice of machine is made a completely random way
Question: Simulate the activity of this workshop for 10,000 Units and visually represent machines that are free with a green ball occupied with a red ball?
In the video below I explain step by step the realization of this model under ARENA.
You can also download the corrected (ARENA Model) by clicking below:
https://youtu.be/TG6Ol2dUaC4?list=PLLk00LzBzwBcgzOTKMQVwLIyjhMpEbttz
Case study No.5:
Several identical machines (SETS) with a single operator
Difficulty level:
Recall of starting data:
A company has a manufacturing workshop consisting of three identical machines and an operator.
The operator intervenes on a machine for a random duration corresponding to an exponential law with an average of 5 minutes.
Then the machine works alone for an exponential period of time with an average of 10 minutes.
Question: Simulate the activity of this workshop for 10,000 Units and represent visually
– machines that are free with a green ball occupied with a red ball
– the operator with two different visuals (busy, free)?
– the mahcine/oepator torque to know the operator is busy with which machine.
In the video below I explain step by step the realization of this model under ARENA.
You can also download the corrected (ARENA Model) by clicking below:
https://youtu.be/MS4S_Sn917Y?list=PLLk00LzBzwBcgzOTKMQVwLIyjhMpEbttz
The rest of this training is being finalized, it will be available very soon
